A Guide to Exporting Your Database to Excel
Learn how to export your database to Excel with practical methods for MySQL, PostgreSQL, and SQL Server. This guide covers GUI tools, CLI, and scripts.
Getting data out of a database and into an Excel spreadsheet is a cornerstone of data work, especially for finance and operations teams. It's a simple, powerful way to get financial data into the hands of people who need to analyze, visualize, and share it without needing to be SQL experts. The goal isn't to ditch your powerful database but to empower every team member to tap into that data effectively.
Why Bother Exporting to Excel Anymore?
Sure, modern databases can handle enormous amounts of information, but let's be realistic—Excel is still the go-to tool for most financial analysis. Its universal familiarity and surprisingly powerful features make it a vital part of the data workflow in practically every department, from finance to marketing. This simple export process is the bridge between raw, structured data and real, actionable business insights.
Think about it from a practical standpoint. A finance team needs to pull together an ad-hoc forecast. Instead of waiting for a custom report, they can pull raw sales numbers from a database directly into Excel. Once it's there, they can slice and dice it with PivotTables, run what-if scenarios, and build out their financial models. That kind of self-sufficiency is a massive time-saver, especially during month-end close.
Putting Data to Work Across the Company
The biggest win here is accessibility. Not everyone in your company is a SQL whiz, but almost everyone knows their way around a spreadsheet. By making data available in Excel, you're helping build a more data-savvy culture from the ground up.
Here are a few real-world examples:
- Marketing Deep Dives: A marketing manager exports campaign results from a PostgreSQL database. In Excel, they can quickly calculate click-through rates and customer acquisition costs without needing to write a single query.
- Operational Dashboards: An operations lead pulls the latest inventory data to spot trends, manage stock levels, and whip up a weekly report for their leadership meeting.
- Financial Audits: Accountants constantly need to manipulate and document data for compliance. For them, a clean data export is the starting point for everything. As new tools like AI in accounting become more common, having structured data in a flexible format like Excel is the essential first step toward smarter automation.
The point isn't to replace your robust database. It's to build efficient, repeatable workflows that let every team member work with data confidently in an environment they already know and trust. At Mintline, we believe in eliminating tedious copy-pasting to free up your finance team for more strategic work.
Choosing Your Export Method: GUI vs. Command Line
When it's time to get data out of a database and into Excel, you've got two main roads you can travel: the visual path with a Graphical User Interface (GUI) or the more direct, script-based route using a Command Line Interface (CLI).
Neither one is inherently "better" than the other. The best choice really boils down to what you're trying to accomplish. Are you doing a one-off analysis for a colleague, or setting up a sales report that needs to run every single week? Your answer changes everything.
The Power of Visual Tools
For most people, especially those just getting their feet wet, a GUI is the friendliest way to start. Tools like DBeaver or SQL Server Management Studio (SSMS) provide a comfortable point-and-click environment that makes exporting feel intuitive.
You can browse your tables visually, build queries with helpful auto-complete features, and get your results into a CSV or Excel file with just a handful of clicks. This approach is perfect for those quick, unplanned data pulls or for helping out team members who don't live and breathe code.
The real magic of a GUI is the immediate feedback. You see your data right away. It's easy to sort and filter on the fly before you even think about exporting, making the whole process feel much more tangible. This is a massive help when you're still exploring a dataset and aren't 100% sure what you're looking for yet. It allows for quick experiments without the hassle of writing and debugging a script for every little tweak.
Shifting to the Command Line
On the other side of the coin, we have the command line. Firing up a tool like PostgreSQL’s psql or the mysql command-line client might feel a bit old-school at first, but don't let the blinking cursor fool you—this is where you unlock serious automation.
Once you nail down the command to export the exact data you need, you can save it as a script and run it again and again. That's the secret to making any repetitive data task ridiculously efficient.
Think about it: you need to pull a sales report every single Monday morning. With a CLI script, you can schedule that task to run automatically, saving the finished file to a shared folder before you’ve even poured your first cup of coffee. That kind of set-it-and-forget-it workflow just isn't on the table with a manual, GUI-based export.
The core difference really comes down to intent. A GUI is for exploring and getting a task done right now. A command line is for building a repeatable process you can use forever. Both are vital skills in any data professional's toolkit.
This handy decision tree can help you figure out which path makes the most sense for your current task.
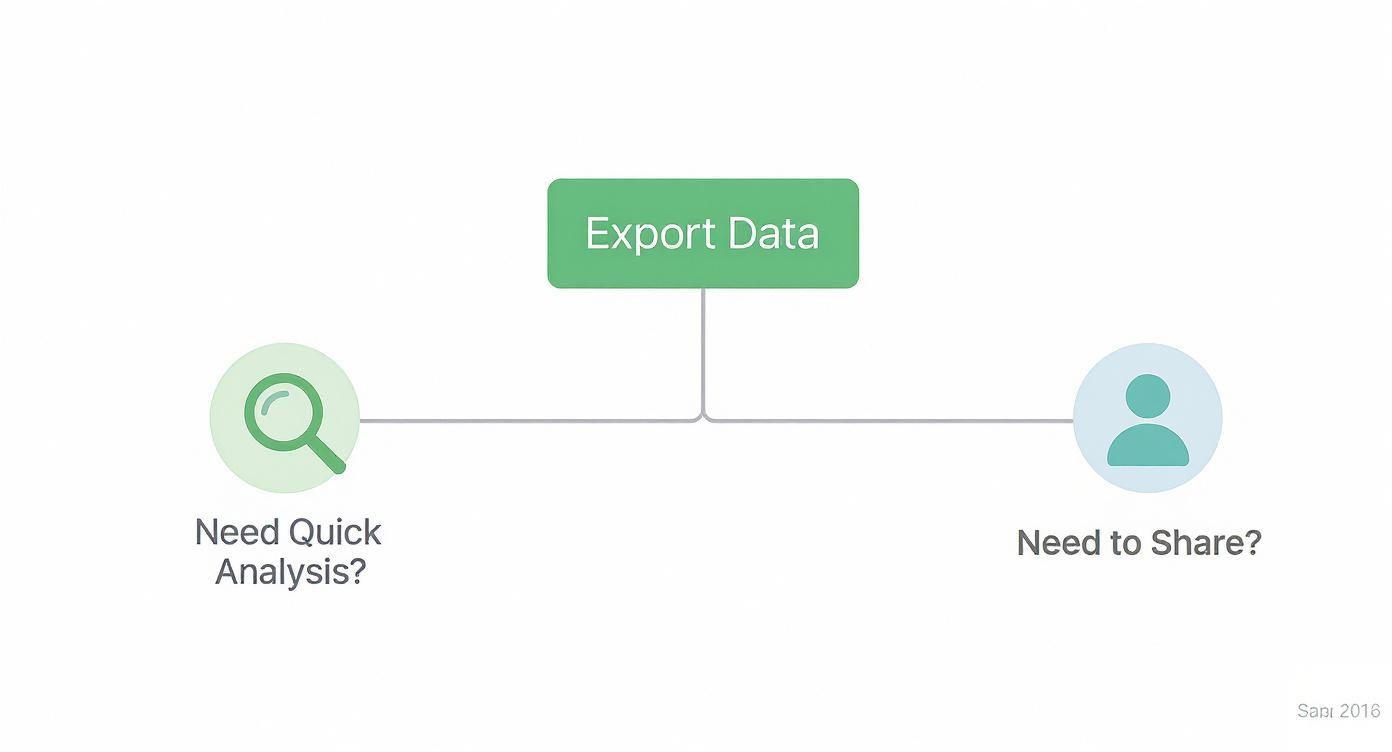
As you can see, if you need a quick, ad-hoc analysis or a file to share with someone immediately, a GUI is often your best bet. But the moment you need to automate a process or schedule a recurring export, the CLI becomes the clear winner.
GUI vs. CLI Export Methods: A Quick Comparison
To put it all into perspective, here’s a quick breakdown of how these two approaches stack up against each other.
| Feature | GUI (Graphical User Interface) | CLI (Command Line Interface) |
|---|---|---|
| Ease of Use | Very user-friendly, low learning curve. Ideal for beginners. | Steeper learning curve; requires knowledge of specific commands. |
| Speed for One-Off Tasks | Generally faster for a single, exploratory export. | Slower for a single task due to initial script setup. |
| Repeatability | Manual process every time; not suitable for automation. | Excellent. Write a script once, run it infinitely. |
| Automation | Not possible. Requires human interaction for every export. | The gold standard for scheduled and automated tasks (e.g., cron jobs). |
| Resource Usage | Tends to be more resource-intensive (memory, CPU). | Very lightweight and efficient. |
| Best For... | Quick data exploration, ad-hoc analysis, non-technical users. | Recurring reports, data pipeline integration, scheduled tasks. |
Ultimately, choosing between a GUI and a CLI isn't about picking a "winner." It's about picking the right tool for the job at hand. Many experienced developers and analysts find themselves using both regularly—a GUI for quick lookups and a library of CLI scripts for all the heavy lifting.
Alright, let's dive into the practical side of things. Getting your data out of a database and into a usable format like CSV—which Excel loves—is a daily task for many of us. We'll look at how to pull this off with the big three: MySQL, PostgreSQL, and Microsoft SQL Server, covering both the easy point-and-click methods and the more powerful command-line approaches.
Before you even think about which button to click or command to type, there's one crucial detail to sort out: character encoding. Ever exported a file and seen names with special characters turn into a mess of gibberish, like ü becoming ü? That's an encoding mismatch. Always, always export using UTF-8. It’s the universal standard that handles pretty much any character you can throw at it, saving you a world of hurt, especially if you’re working with international data.
Exporting from MySQL
MySQL is everywhere, and thankfully, it gives you a couple of straightforward ways to get your data out.
If you’re a visual person, a tool like MySQL Workbench is your best friend. You just run your SELECT query, and once the results pop up in the pane below, you’ll see an 'Export' button. Click it, choose CSV, name your file, and you’re done. It’s perfect for those one-off data pulls where you just need the numbers and don't want to get bogged down in syntax.
For scripting or automating exports, the mysql command-line utility is the way to go. You can run a query and pipe the output straight into a file.
A quick-and-dirty command might look something like this:
mysql -u your_user -p your_database -e "SELECT id, name, sale_date, amount FROM sales WHERE region = 'NL';" > sales_report.csv
This command logs in, runs the query you pass to the -e flag, and dumps the results into sales_report.csv. The downside is that the formatting can be a bit rough around the edges. For a much cleaner result, you’ll want to use SELECT ... INTO OUTFILE.
The
SELECT ... INTO OUTFILEstatement is a game-changer for clean CSV exports directly from MySQL. It gives you precise control over delimiters, headers, and file paths, ensuring the output is perfectly structured for Excel every time.
Here’s how you’d use it to create a properly formatted file, complete with headers:
SELECT 'ID', 'Name', 'Sale Date', 'Amount'
UNION ALL
SELECT id, name, sale_date, amount
FROM sales
WHERE region = 'NL'
INTO OUTFILE '/var/lib/mysql-files/sales_report.csv'
FIELDS TERMINATED BY ','
ENCLOSED BY '"'
LINES TERMINATED BY '\n';
This technique builds the header row right into the query and saves a perfectly structured CSV to a secure location on the server.
Getting Data Out of PostgreSQL
PostgreSQL is a powerhouse known for its reliability and advanced features, and it makes exporting data just as painless.
The fastest way is with a graphical client like pgAdmin or the versatile DBeaver. The process is similar to Workbench: run your query, right-click the results grid, and look for an option like 'Export data' or 'Save to file'. These tools hide the complexity, giving you a simple dialog to pick your format (CSV), set the delimiter, and choose whether to include the column headers.
When you need to automate this process, PostgreSQL's command-line tool, psql, is what you'll turn to. Its \copy meta-command is built specifically for this kind of work.
Here’s a typical example using \copy:
\copy (SELECT customer_id, order_date, total_value FROM orders WHERE status = 'shipped') TO 'C:/reports/shipped_orders.csv' WITH (FORMAT CSV, HEADER);
This single command executes the query and copies the results directly to a local file on your computer (shipped_orders.csv), adding a header row automatically. It’s clean, incredibly fast, and perfect for scripting.
Working with Microsoft SQL Server
In any Microsoft-heavy environment, SQL Server is king. Unsurprisingly, it plays very nicely with other Microsoft products, especially Excel.
Your go-to tool here will be SQL Server Management Studio (SSMS). Once your query results are on screen, just right-click the grid, select 'Save Results As...', and pick CSV from the list of file types.
SSMS also comes with a heavyweight Import and Export Wizard. While it can feel like using a sledgehammer to crack a nut for a simple export, it’s incredibly powerful for more complex jobs. It gives you fine-grained control over column mappings and data type conversions, which is a lifesaver when you're moving data between different systems, not just creating a simple CSV file.
Automating Exports with Python and PowerShell Scripts
Look, exporting data by hand is fine now and then. But if you find yourself running the same report every single day, week, or month, it's time to stop. Manual work doesn't scale. For any recurring task, automating the pipeline from your database to Excel is the only way to go. It’s not just about saving a few minutes; it's about eliminating human error and guaranteeing your reports are bang-on, every single time.
This is where scripting comes in, and two of the heavy hitters are Python and PowerShell. They're built for different environments, but both are fantastic at turning a repetitive data pull into a workflow you can just set and forget.

Using Python with Pandas and SQLAlchemy
When it comes to data work, Python is pretty much the industry standard, and for good reason. With libraries like Pandas and SQLAlchemy, you can connect to just about any database, fire off a query, and dump the results into a proper .xlsx file with shockingly little code.
The real beauty here is the flexibility. You're not just mindlessly copying data. You can clean it, reshape it, and perform calculations before it even hits the spreadsheet. Imagine calculating new columns on the fly, tidying up headers, or even merging data from a few different tables—all within your script.
Here’s a real-world example. Let's say we need to pull all completed orders from a PostgreSQL database into an Excel file for the sales team.
import pandas as pd
from sqlalchemy import create_engine

# First, your database credentials
db_user = 'your_username'
db_password = 'your_password'
db_host = 'your_host'
db_port = '5432'
db_name = 'your_database'

# Build the connection string
connection_str = f'postgresql://{db_user}:{db_password}@{db_host}:{db_port}/{db_name}'
engine = create_engine(connection_str)

# The SQL query to get what we need
sql_query = "SELECT customer_id, order_date, total_amount FROM orders WHERE status = 'completed';"

# Let Pandas do the heavy lifting
df = pd.read_sql(sql_query, engine)

# And save it straight to Excel
df.to_excel('completed_orders_report.xlsx', index=False, sheet_name='Completed Orders')

print("Export completed successfully!")
Just like that, you get a clean Excel file named completed_orders_report.xlsx with zero manual clicks. This same approach works wonders for other messy data sources, too. For instance, if you have data trapped in a document, you can learn how to extract a table from a PDF and feed it into a similar Pandas workflow.
PowerShell for Windows Environments
If your world revolves around Microsoft, then PowerShell is your best friend. Its native integration with SQL Server makes it incredibly powerful for automating exports on Windows machines. The key player here is the Invoke-Sqlcmd cmdlet, which lets you run queries and send the results wherever you need them to go.
The secret sauce in PowerShell is the pipeline (
|) operator. It lets you chain commands together, feeding the output of your SQL query directly into an exporter likeExport-Csv. It’s the ultimate one-liner for automation.
Here’s how you could grab a list of active products from SQL Server and save it as a CSV file, all in a single line of code:
Invoke-Sqlcmd -ServerInstance "YourServerName" -Database "YourDatabase" -Query "SELECT ProductID, ProductName, UnitPrice FROM Products WHERE Discontinued = 0;" | Export-Csv -Path "C:\Reports\Active_Products.csv" -NoTypeInformation
This command connects to the server, runs the query, and generates a perfect CSV ready for Excel. That -NoTypeInformation switch is a pro tip; it stops PowerShell from adding an annoying metadata header to your file, keeping it clean.
This kind of scripting is a game-changer for producing datasets for analysis. Think about national statistical agencies like Statistics Netherlands (CBS). They manage enormous databases tracking everything from business trends to population demographics. The Netherlands has held a steady population of around 17 million for nearly a decade, and making that data available through machine-readable exports is vital for researchers and policymakers. You can dig into more of these Dutch population insights on Statista.com.
Best Practices for Clean and Usable Excel Exports

Getting data out of a database and into Excel is one thing, but getting it there in a way that’s actually useful is another challenge entirely. The real goal is to create a spreadsheet that’s clean, accurate, and ready for someone to start working with immediately. If you just hit 'export' without a second thought, you're often left with a frustrating mess of broken data and formatting nightmares.
One of the biggest culprits is Excel itself. It has a notorious habit of trying to be "helpful" by automatically formatting your columns, which can completely mangle your data. Think about product IDs like 00789 or postcodes like 01234. Excel loves to see those leading zeros and promptly strips them away, treating the value as a number.
It’s the same story for long numeric strings or complex identifiers, which often get mangled into scientific notation. The best way to fight back is to explicitly define these columns as 'Text' when you import the data. This tells Excel to keep its hands off and leave your formatting exactly as you intended.
Preserving Data Integrity
Data integrity is everything. A few simple checks and balances during the export can save you hours of painful cleanup work down the line.
Here are a few things I always keep in mind:
- Always Use UTF-8 Encoding: If your dataset contains any special characters, accents, or symbols (like
é,ü, or€), you absolutely must export using UTF-8. It's the standard for a reason—it stops your characters from turning into gibberish and ensures names and places show up correctly. - Filter at the Source, Not in the Spreadsheet: Excel has a hard row limit of just over a million rows. Don't dump a massive table and then try to filter it down in Excel. It's wildly inefficient. Do the heavy lifting in your SQL query with a
WHEREclause to pull only the exact data you need. - Take Control of Your Dates: Dates are another classic victim of Excel's auto-formatting. To stop
YYYY-MM-DDfrom being misinterpreted, I often format them as text directly in the SQL query (TO_CHARin PostgreSQL orCONVERTin SQL Server) before they even leave the database. This gives you total control.
The most reliable data is the data you control from start to finish. By setting data types and filtering within your SQL query, you’re not just exporting data; you’re delivering a trustworthy, analysis-ready product.
This kind of structured, reliable approach is becoming the norm, even for major organisations. For example, Statistics Netherlands (CBS) now publishes its comprehensive national accounts data directly in Excel format, ditching static PDFs. This makes the data immediately usable for automated processing and guarantees its integrity right from the source. You can see how they structure their economic data on the CBS website.
Structuring Data for Analysis
Finally, give some thought to how the data will actually be used. A flat file is fine, but a well-structured one is infinitely better. For more complex datasets, I’ve found that organising information using a key-value pair structure in the database can make the resulting export much cleaner and easier to understand in Excel.
Here at Mintline, we know that a little prep work on the database side makes the whole workflow smoother. It's the difference between handing someone a pile of raw data and delivering actionable insight.
Got Questions About Database to Excel Exports?
When you're trying to get data out of a database and into a spreadsheet, you're bound to run into a few common snags. It happens to everyone. Let's walk through some of the most frequent questions I hear and get you past those little roadblocks so your data moves smoothly.
What Do I Do if My Dataset Is Too Big for Excel?
This is a big one. You run a query, export the file, and then... Excel throws an error or just cuts off your data. It's a hard lesson to learn, but Excel has a strict limit of 1,048,576 rows.
The best way to deal with this is to handle it at the source. Don't export everything and hope for the best. Instead, go back to your SQL query and make it smarter. Use WHERE clauses to filter for a specific date range, a certain product category, or a particular customer segment. The goal is to pull only the data you actually need for your analysis.
But what if you genuinely need to analyse a massive dataset? Honestly, Excel isn't the right tool for that job. You're better off using something built for big data, like Power BI or Tableau. They can connect straight to your database and handle millions of rows without breaking a sweat, saving you the headache of an intermediate spreadsheet.
Why Do My Dates and Numbers Look Wrong in Excel?
Ah, the classic formatting nightmare. You open a CSV, and suddenly all your product IDs are missing their leading zeros, or your dates have been mangled into a completely different format. This happens because Excel tries to be helpful by guessing the data type for each column, and it often guesses wrong.
The trick is to take control away from Excel's auto-formatting. Don't just double-click the CSV file to open it. Instead, go to the 'Data' tab in Excel and use the 'From Text/CSV' import tool. This wizard lets you step through the import process and tell Excel exactly what each column contains. You can set that product ID column to 'Text' to ensure it keeps those leading zeros, every single time.
It's a tiny extra step, but it makes a world of difference in keeping your data clean and accurate.
Should I Use CSV or an Excel (.xlsx) File?
This really boils down to what you need to accomplish. CSV is the universal language of data transfer. It's simple, lightweight, and you can open it with pretty much anything. For a quick, no-frills data dump, it's perfect.
The catch is that CSV files are just plain text. They can't handle any formatting, formulas, or multiple worksheets. If your goal is to create a report with several sheets, preserve specific number formats, or include some pre-built charts, you'll want to export directly to an .xlsx file. The easiest way to do this is usually with a script. A library like Python's pandas, for instance, gives you incredible control over building a polished, multi-sheet Excel workbook from scratch.
Tired of manually exporting transaction data and chasing down receipts? It’s a tedious grind that pulls you away from what really matters. At Mintline, we automate all of it. Our platform uses AI to match every bank transaction with its receipt, so you can ditch the messy spreadsheets for good. Stop wrestling with data and start closing your books in minutes. See how it works at https://mintline.ai.