Your Dashboard
The dashboard gives you an overview of your financial data at a glance.
Stats Bar
Four key metrics at the top:
Statements
Bank statements processed
Receipts
Total receipts in your account
Matches
Confirmed receipt-to-transaction matches
Usage
Plan usage this billing period
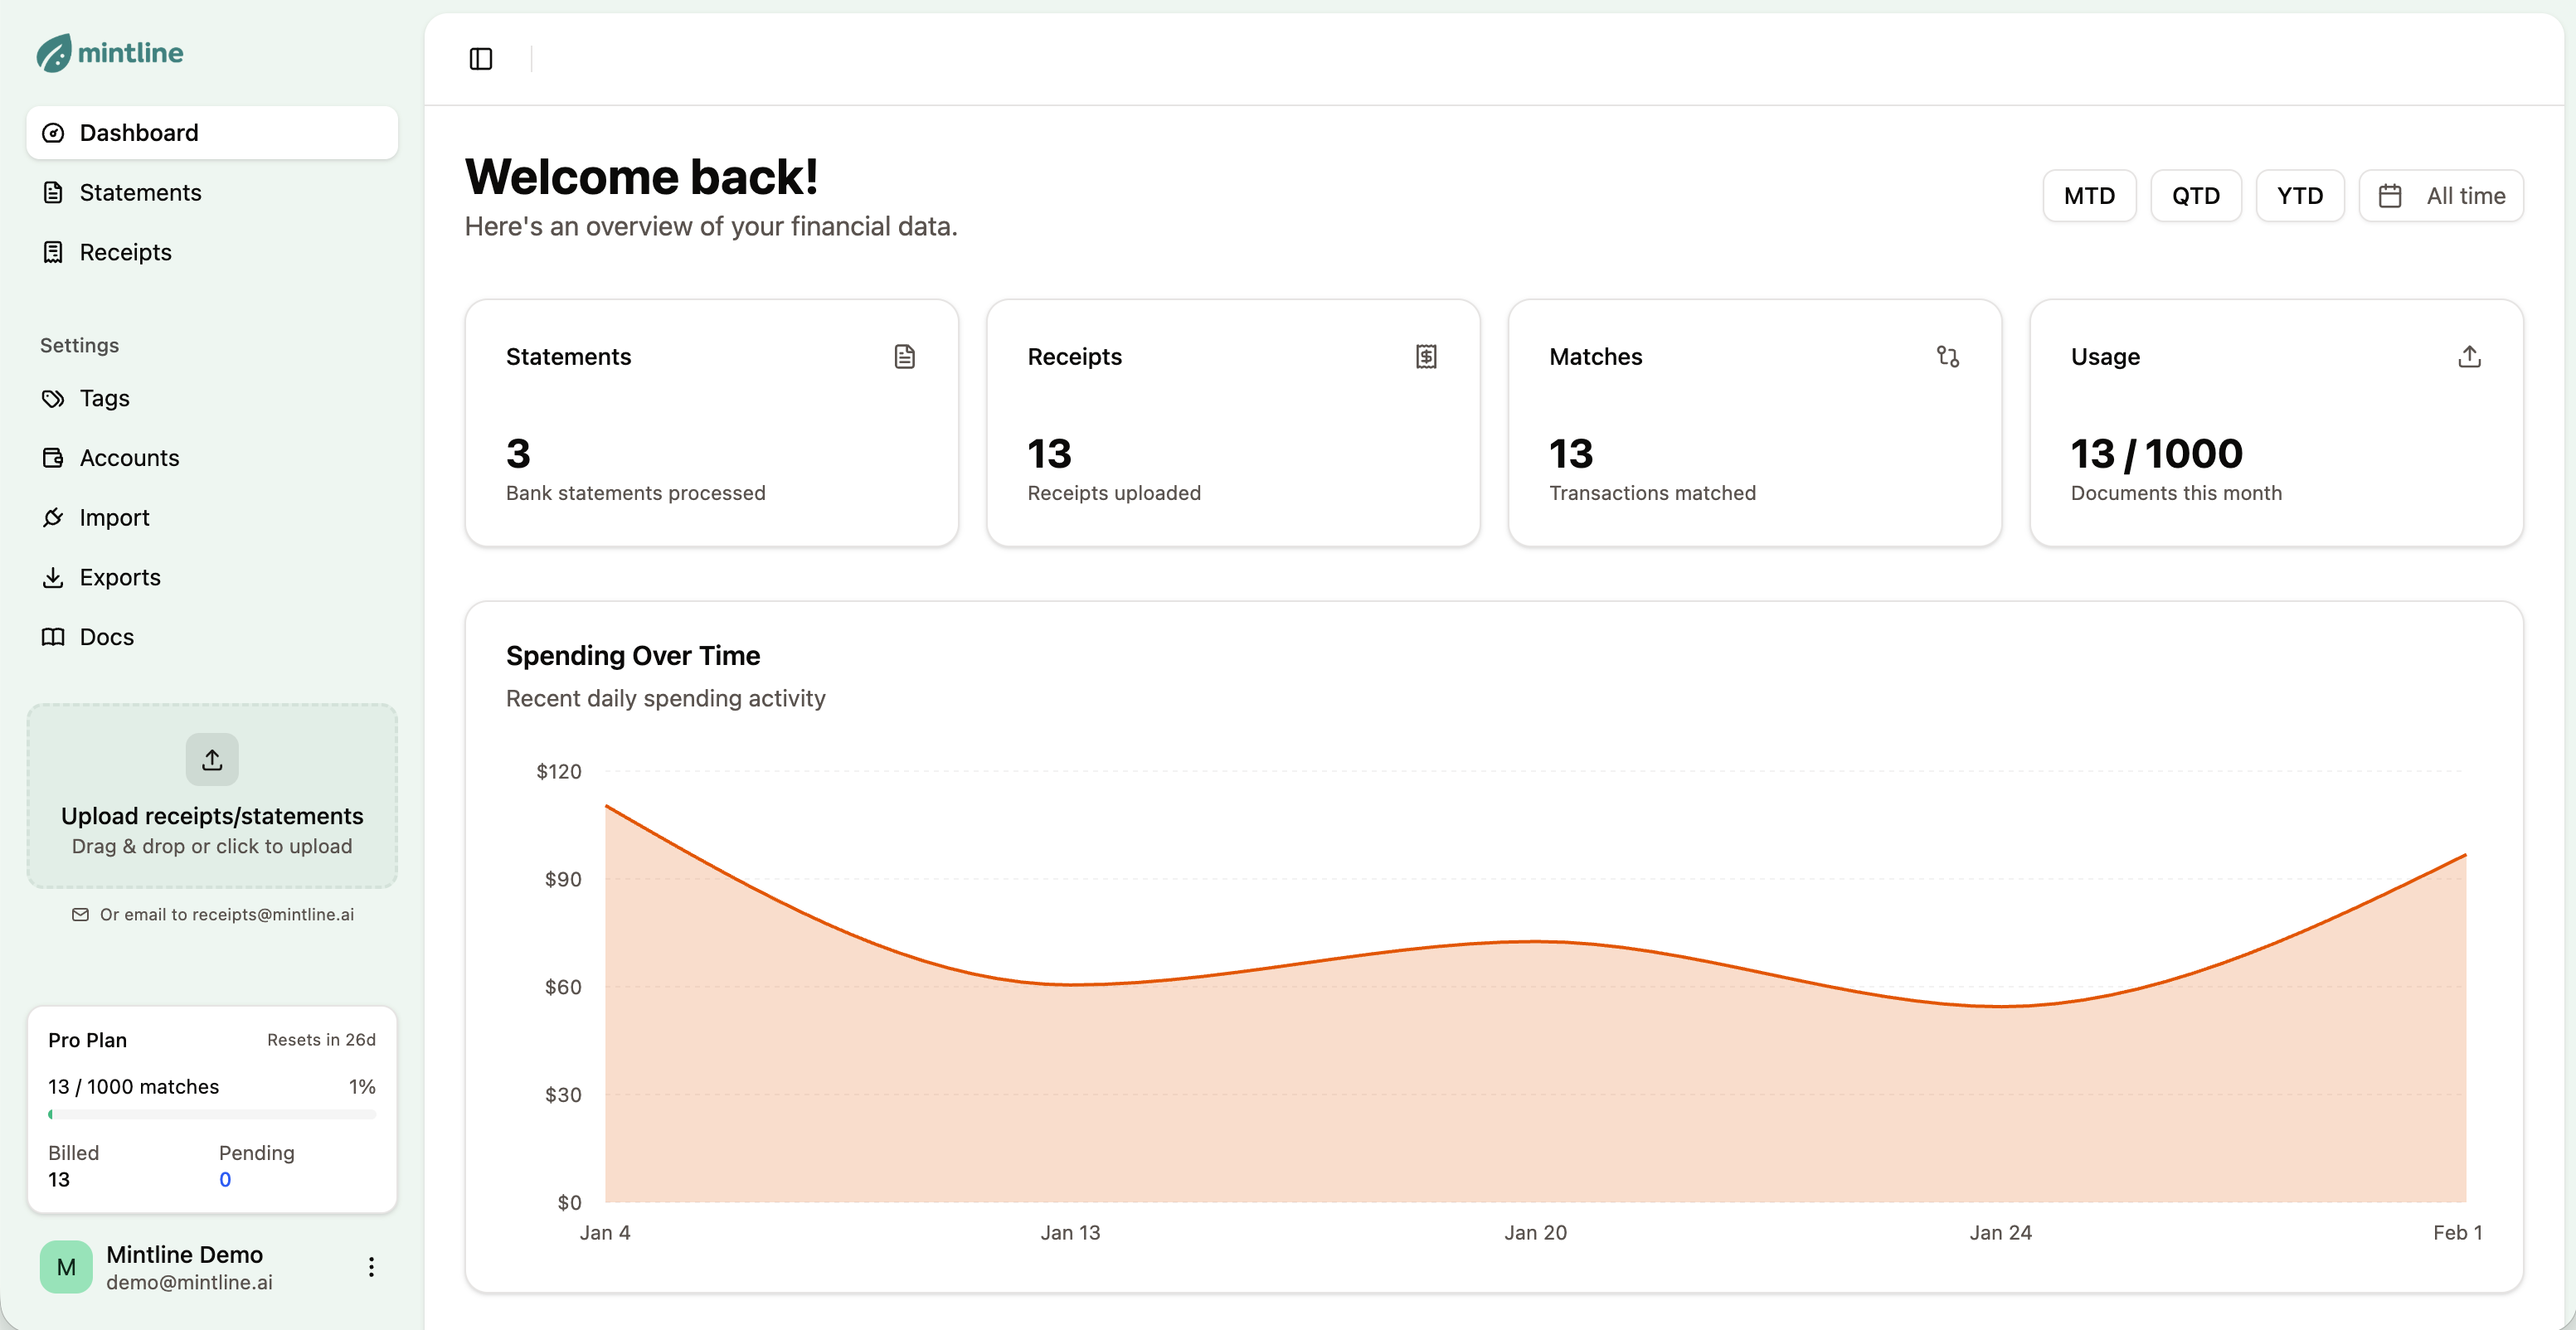
Dashboard overview with key metrics
Time Filters
Filter all dashboard data by:
- •MTD - Month to date
- •QTD - Quarter to date
- •YTD - Year to date
- •All time - Everything
Spending Over Time
Area chart showing daily spending. Only includes matched receipts for verified data.
- •Peaks = high spending days
- •Trends help identify patterns
Dashboard widgets showing spending trends and analytics
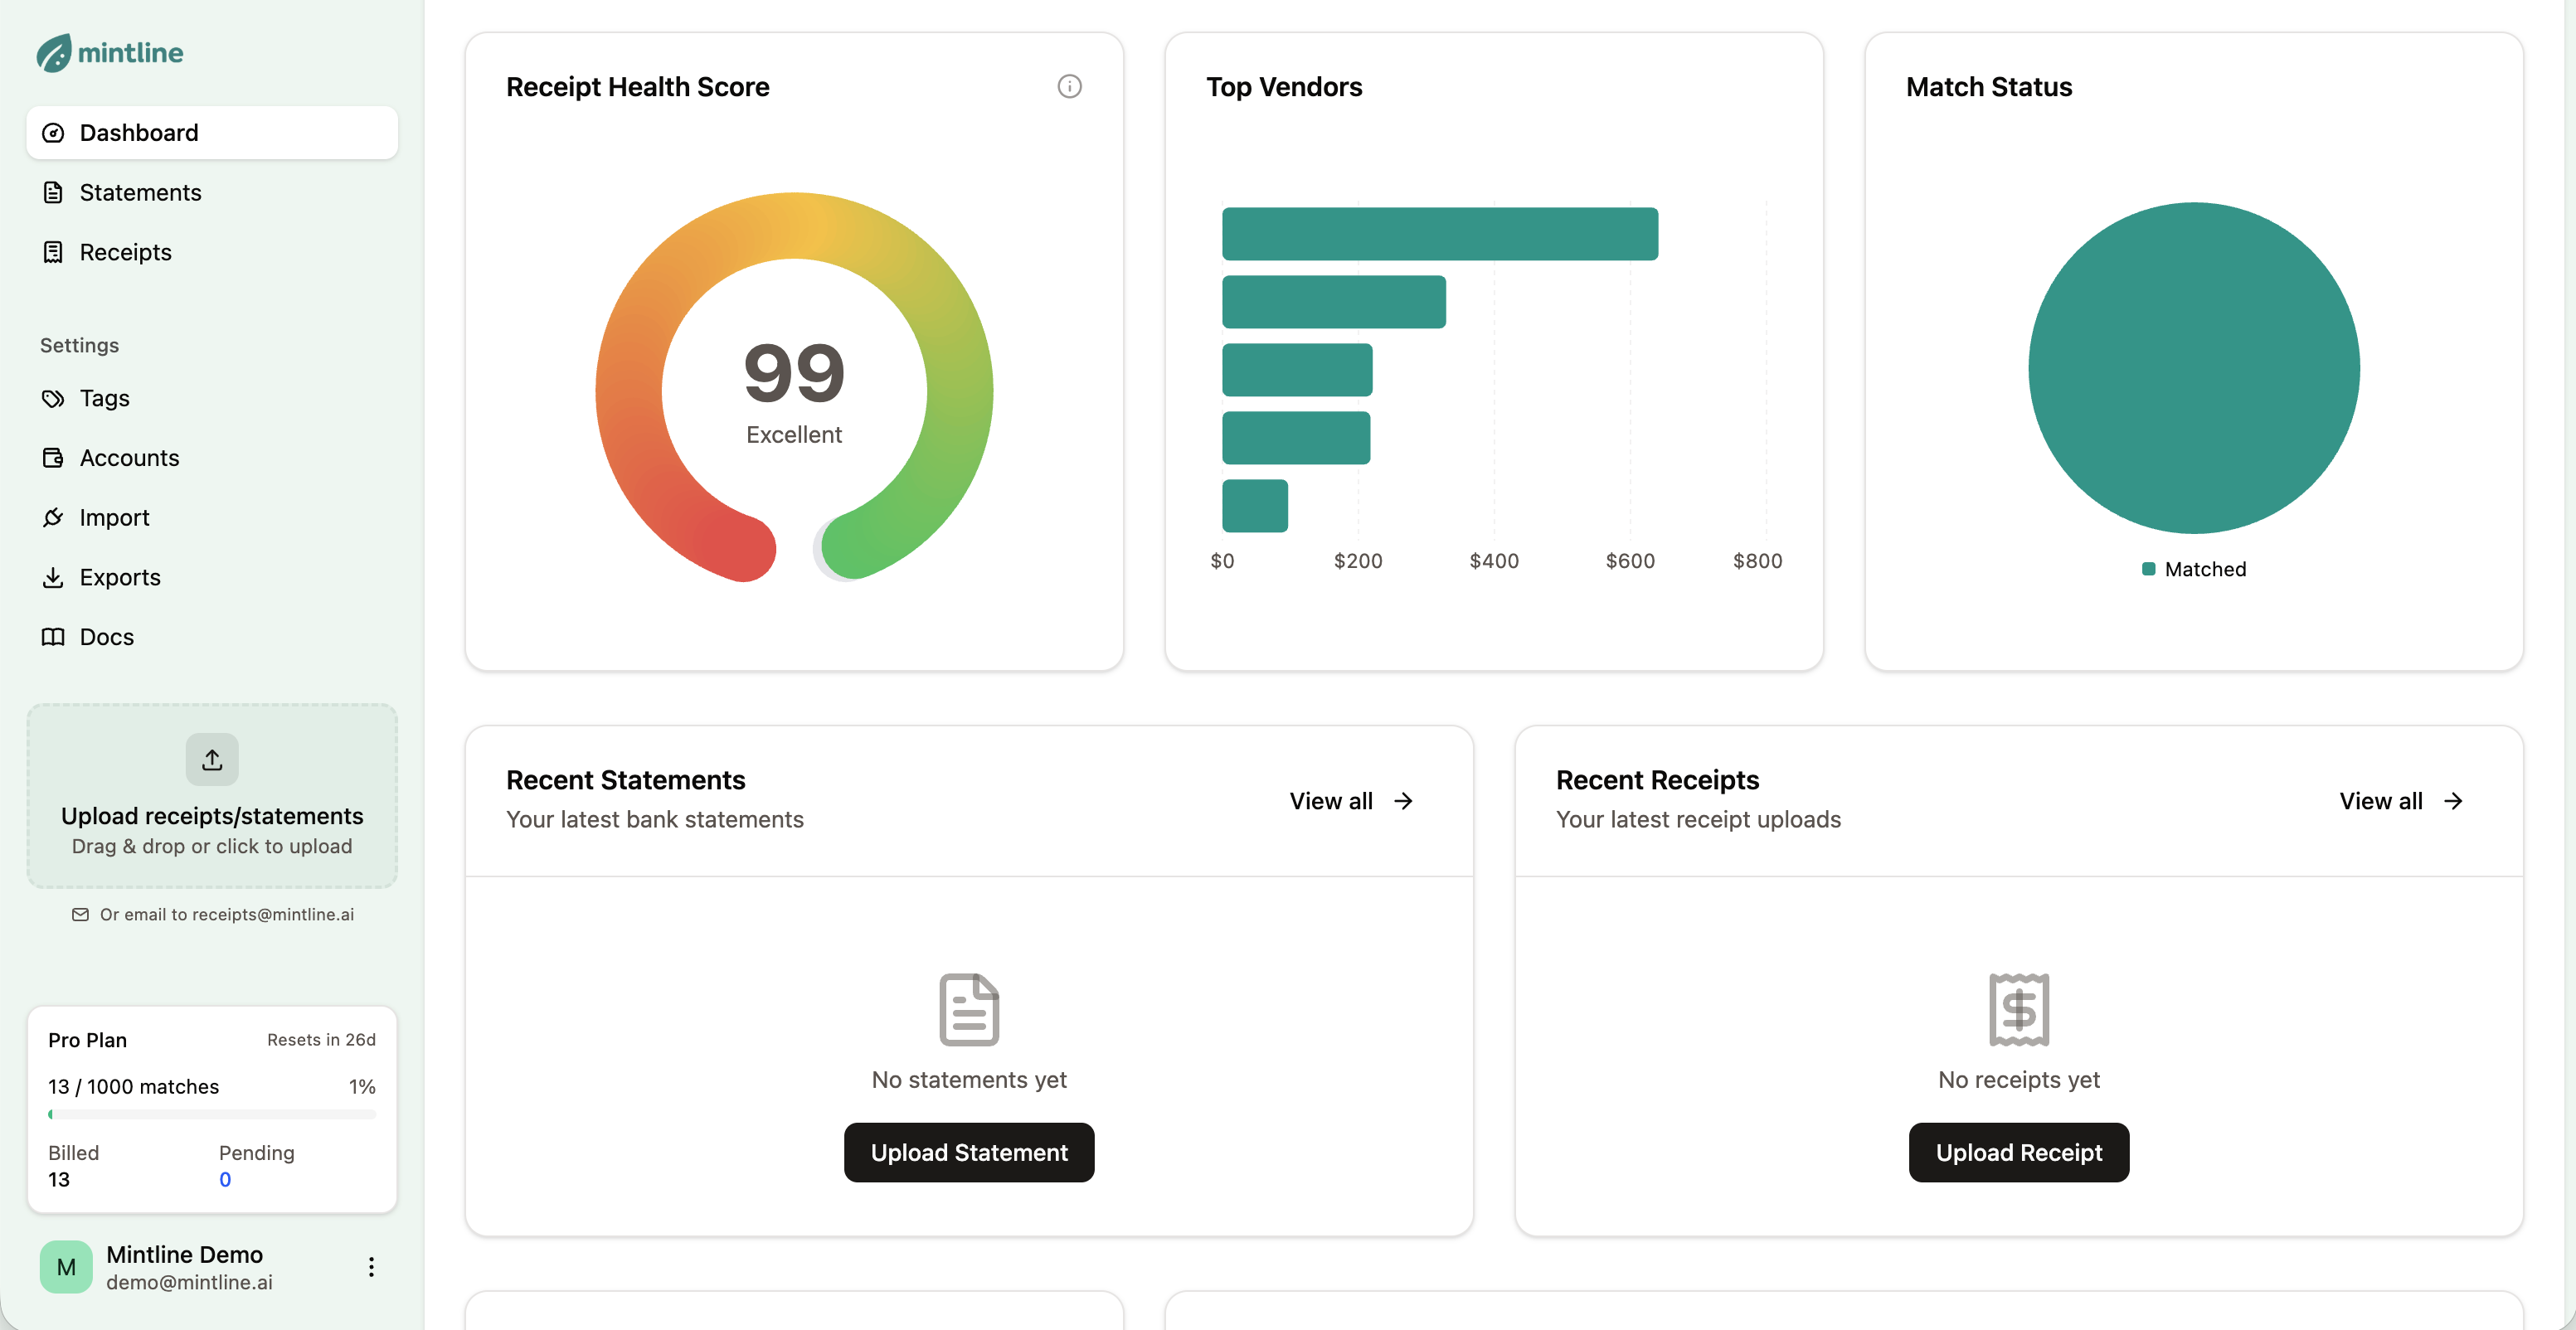
Receipt Health Score
A 0-100 gauge showing how well-organized your records are:
90-100
Excellent (green)70-89
Good50-69
Needs attention<50
PoorImprove your score by:
- • Matching more receipts
- • Reviewing proposed matches
- • Adding notes to transactions without receipts
Top Vendors
Bar chart ranking vendors by total spending. Use this to:
- •Identify major expenses
- •Spot anomalies
- •Track expense categories
Match Status
Pie chart showing:
- •Matched - Linked to receipts
- •Proposed - Awaiting review
- •Unmatched - No receipt found
Quick Actions
The sidebar upload area lets you:
- •Drag and drop files
- •Click to browse
- •Email to receipts@mintline.ai
Next Steps
Learn how to export your matched data for accountants or tax filing.
Learn how to export your data →